The Demise of the Natural Rate Hypothesis

Quote for today (and tomorrows)...

The history of economic thought in the twentieth century is the history of a struggle between classical and Keynesian ideas. Two events have transformed this history since 1900. The first was the Great Depression of the 1930s, a prolonged period of high unemployment and low growth. The second was the Great Stagflation of the 1970s, a period of simultaneous high inflation and high unemployment. I believe the Great Recession is a third transformative event. Just as the Great Depression and the Great Stagflation changed economics forever, so will the Great Recession.  Prosperity for All, Page 31.

Read about this and so much more in Prosperity for All: How to Prevent Financial Crises

Three Facts about Debt and Deficits

The U.K. Chancellor of the Exchequer, Philip Hammond, will present his Autumn Statement to Parliament on Wednesday.  In the heated debate over austerity, this piece offers three facts about debt and deficits which, I hope, will help shed light on the issues he will face. 

Fact Number 1: UK Public Sector Debt is Not Large

Normal
0


false
false
false

EN-US
X-NONE
X-NONE


 <w:LatentStyles DefLockedState="false" DefUnhideWhenUsed="false"
DefSemiHidden="false" DefQFormat="false" DefPriority="99"
LatentStyleCount="3…

                                       Chart 1: UK Public Sector Debt

The UK public debt is equal to £1.7 trillion and it is increasing at a rate of £5,170 per second (National Debt Clock UK). But although government debt is increasing at a rapid rate, that fact does not pose a threat to the solvency of the UK Treasury.  Government debt should not be measured in pounds; it should be measured in GDPs. When GDP is high, so are tax revenues, and so is the ability of the government to repay.

Chart 1 shows the ratio of government debt to GDP for every year beginning in 1692. Notably, this ratio has been as high as 250%, during the Napoleonic War, and almost as high again at the end of WWII.

Fact Number 2: Governments Do Not Repay Debt: They Grow Out of It

Chart 2 reproduces the debt to GDP ratio from Chart 1, but the time scale is limited to the years from 1920 to 2015.  Public sector debt is the upper solid line, measured on the right scale as a percentage of GDP.  The line marked by circles, measured on the left scale, also as a percentage of GDP, is the value of the public sector deficit, smoothed by averaging adjacent values. A positive number indicates that the public sector spent more than it received in revenue.

Normal
0


false
false
false

EN-US
X-NONE
X-NONE


 <w:LatentStyles DefLockedState="false" DefUnhideWhenUsed="false"
DefSemiHidden="false" DefQFormat="false" DefPriority="99"
LatentStyleCount="3…

Chart 2: Debt, Deficits and Interest Rates Net of NGDP Growth

On average, the public sector borrowed more in every year from 1920 to 2015. Nevertheless, the debt to GDP ratio fell continuously from the end of WWII to the early noughties. The public sector borrowed more, but its debt, properly measured, fell.

George Osborne, former Chancellor of the Exchequer, planned to bring the government budget into surplus by the year 2020. That plan represented a break from UK post WWII policy. A surplus of public sector borrowing is neither necessary, nor sufficient, to reduce government debt when debt is measured as a fraction of the government’s ability to repay.

Fact Number 3: Government Debt Should Not Be Zero. Ever!

Nation states borrow to provide public capital: For example, rail networks, road systems, airports and bridges. These are examples of large expenditure items that are more efficiently provided by government than by private companies.

The benefits of public capital expenditures are enjoyed not only by the current generation of people, who must sacrifice consumption to pay for them, but also by future generations who will travel on the rail networks, drive on the roads, fly to and from the airports and drive over the bridges that were built by previous generations. Interest on the government debt is a payment from current taxpayers, who enjoy the fruits of public capital, to past generations, who sacrificed consumption to provide that capital.

Normal
0


false
false
false

EN-US
X-NONE
X-NONE


 <w:LatentStyles DefLockedState="false" DefUnhideWhenUsed="false"
DefSemiHidden="false" DefQFormat="false" DefPriority="99"
LatentStyleCount="3…

                        Chart 3: Public Investment as a Percentage of GDP

To maintain the roads, railways, airports and bridges, the government must continue to invest in public infrastructure. And public investment should be financed by borrowing, not from current tax revenues. 

Chart 3 shows that investment in public infrastructure was, on average, equal to 4.3% of GDP in the period from 1948 through 1983. It has since fallen to 1.6% of GDP. There is a strong case to be made for increasing investment in public infrastructure. First, the public capital that was constructed in the post WWII period must be maintained in order to allow  the private sector to function effectively. Second, there is a strong case for the construction of new public infrastructure to promote and facilitate future private sector growth.

The debt raised by a private sector company should be strictly less than the value of assets, broadly defined. That principle does not apply to a nation state. Even if government provided no capital services, the value of its assets or liabilities should not be zero except by chance.

National treasuries have the power to transfer resources from one generation to another. By buying and selling assets in the private markets, government creates opportunities for those of us alive today to transfer resources to or from those who are yet to be born. If government issues less debt than the value of public capital, there will be an implicit transfer from current to future generations. If it owns more debt, the implicit transfer is in the other direction. 

The optimal value of debt, relative to public capital, is a political decision.  Public economics suggests that the welfare of the average citizen will be greatest when the growth rate is equal to the interest rate. Economists call that principle the golden rule. Democratic societies may, or may not, choose to follow the golden rule. Whatever principle the government does choose to fund its expenditure, the optimal value of public sector borrowing will not be zero, except by chance.

Recommendations for the Autumn Statement

What can we learn from these three facts and what should we look for in the Autumn statement?

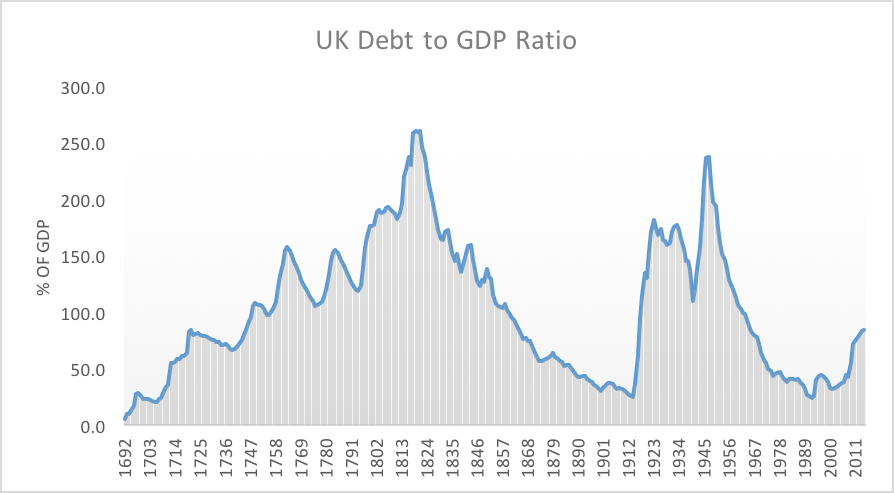
We should not be too concerned about a debt to GDP level approaching 100%. We have been there before and we will go there again.  We should be concerned that public spending has shifted away from investment on the capital account and towards the current account.

Economics has the reputation of being the dismal science. It is a dismal reality that there are diminishing returns to the prolongation of life. As we invest an increasing share of resources into advanced drugs and new treatments, the additional benefits, measured in extra weeks of life, will shrink.

As the population ages and life expectancy increases there will be an increasing burden on pensions and the National Health Service. These expenditures are predictable and can be planned for by stabilizing the deficit on the current account either through limits on expenditures or through increased taxes. Our politicians must choose how much, as a society, we spend on health. And this choice must be presented to the electorate.

Capital account expenditures should be separated from the current account and increased back to 1960s levels. Work by Paul Romer, the new Chief Economist of the World Bank, suggests that these expenditures have the potential to pay for themselves. He advocates the creation of new charter cities and the expansion of existing cities. The last coalition government’s proposal to create a ‘Northern Powerhouse’ is an example of an investment of this kind.

There are also strong economic arguments to consider education expenditures at all levels, primary, secondary and tertiary, to be a capital expenditure. Education is an investment in the British people from which we all gain. But as with all capital expenditures, investment in education should be targeted towards the areas that have the highest potential for social impact.

This post is mirrored in the NIESR site and the Bath IPR Blog.

The NRH is Wrong

Here is an excerpt from Chapter 3, pages 32-33, of Prosperity for All. (Link to Amazon US, Link to Amazon UK, Amazon Kindle).

"The natural rate hypothesis (NRH) is the idea that unemployment has an inherent tendency to return to some special “natural rate” that is a property of the available technology for finding jobs. It is a fact of nature, a bit like the gravitational constant in celestial mechanics. The theory of the NRH natural rate hypothesis has been taught to every economist in every top economics department for the past thirty years. As part of the package, economists learn that the natural rate cannot be influenced by fiscal or monetary policy."

"Even today, the NRH is a central component of New Keynesian economics and, with very few exceptions, central bankers, politicians, and economic talking heads use the theory of the natural rate of unemployment to explain their views on the appropriate stance of monetary policy. I believe that the NRH  is false, and this fact has important consequences. If central bankers are working with a false theory, they are likely to make bad decisions that affect all of our lives."

(c) Oxford University Press

Not Keen on more Chaos in the Future of Macroeconomics

Steve Keen argues that we should use chaos theory as a future foundation for macroeconomics. We tried that thirty-five years ago and rejected it. Here’s why.  

In response to Olivier Blanchard’s recent attempt to move towards a consensus in macroeconomics, Steve Keen has launched a blistering attack on the DSGE approach. His thesis is that the economy is best modeled as a complex adaptive system. I am, or at least was, very receptive to that idea. But in contrast to Steve, I believe that DSGE models are here to stay, just not New Keynesian DSGE models.

Complexity theory is not a new idea in economics. In June of 1985, Jean-Michel Grandmont and Pierre Malgrange organized a conference in Paris. The conference was dedicated to the idea that the economy is inherently non-linear and that the applications that Steve Keen cites as successful examples of non-linear theory in the physical sciences could be extended to economics.  I was privileged to attend that conference and to present a paper on non-linear business cycles. Many of the conference papers were published in the Journal of Economic Theory.

Among the highlights at the 1985 conference were an important paper by Michele Boldrin and Luigi Montruchio which demonstrated that the representative agent growth model can display chaotic dynamics. Michael Woodford presented a paper entitled “Stationary Sunspot Equilibria in a Finance Constrained Economy”. Roger Guesnerie, Jean Michel Grandmont, Donald Saari, Steven R. Williams, Roes-Anne Danna, Guy Laroque, Raymond Deneckere, Steve Pelikam and Pietro Recclin all presented papers that appeared in the conference volume. Frank Hahn attended and was his usual perceptive and boisterous self. Karl Shell presented a paper that Grandmont later rejected for JET (a somewhat ballsy decision since Karl was editor of JET at the time).  This was also the first time I met Jess Benhabib. We went on to write our classic paper on indeterminacy.

The attendees were a relative who’s who of European and American mathematical economists and the agenda was clear. Can we translate the success of chaos theory and non-linear dynamics from the physical sciences into economics? The answer was very clear. Non!

For me, and I believe for many others, the highlight of the conference was a paper by the American economist William (Buzz) Brock with the title “Distinguishing Random and Deterministic Systems”.  This is a wonderful paper and I recommend you read it. In his conference presentation, Buzz described an experiment that changed the world of fluid dynamics. At one time, physicists described the motion of turbulence in fluids with a high dimensional linear system hit by random shocks. It turns out, the world is not like that. And physicists can prove it.

Buzz described an experiment, conducted by physicists, in which they take two cylinders and put a colored fluid between them. As they rotate the inner cylinder, the motion of the fluid moves from calm motion through cycles to chaos. To measure this transition, they shine a strobe light through the fluid and record a sequence of dots. As the speed of rotation increases, there comes a point where the sequence of dots is well described by a three dimensional differential equation system with a chaotic attracting set. The path of any given sequence is completely deterministic but any given path is sensitive to initial conditions. Paths that initially start close together begin to diverge. This is the ‘butterfly wings’ phenomenon. A butterfly flapping its wings in Brazil can cause a hurricane in the Caribbean.

The obvious question that Buzz asked was: are economic systems like this? The answer is: we have no way of knowing given current data limitations. Physicists can generate potentially infinite amounts of data by experiment. Macroeconomists have a few hundred data points at most. In finance we have daily data and potentially very large data sets, but the evidence there is disappointing. It’s been a while since I looked at that literature, but as I recall, there is no evidence of low dimensional chaos in financial data.

Where does that leave non-linear theory and chaos theory in economics? Is the economic world chaotic? Perhaps. But there is currently not enough data to tell a low dimensional chaotic system apart from a linear model hit by random shocks. Until we have better data, Occam’s razor argues for the linear stochastic model.

If someone can write down a three equation model that describes economic data as well as the Lorentz equations describe physical systems: I'm all on board. But in the absence of experimental data, lots and lots of experimental data, how would we know if the theory was correct?